Crude Oil – Update from 2 months ago
Right before the last OPEC meeting in December 2018 and to avoid the classic noise surrounding the Oil market, I tried to get a better understanding of the supply-demand at that time.
“Oil market is correctly supplied, with a small excess of roughly 500k barrels for each of the last 2 quarters.But clearly, recent production increases are creating more excess.
The market deficit experienced from Q2 2017 to Q4 2017 (with overall -1.6m deficit) ended up in early 2018.
On that basis, assuming that the oil market was balanced in early 2018 and looking at those demand-supply numbers, it is fair to say that oil should be at the same levels or a bit below. In December 2017, crude oil was trading between $55-60. ”
In December 2018, I read a lot of stories about demand collapsing and I decided to look at historical demand:
“Let’s quickly look at history on the demand side:
During 2007-2009, Oil demand experienced a maximum drawdown of 3.2m barrels. I like to take 2007-2009 numbers to gauge what could happen when everything went very wrong.
Other down years were 1992 and 2012 with less than 0.6% decrease.
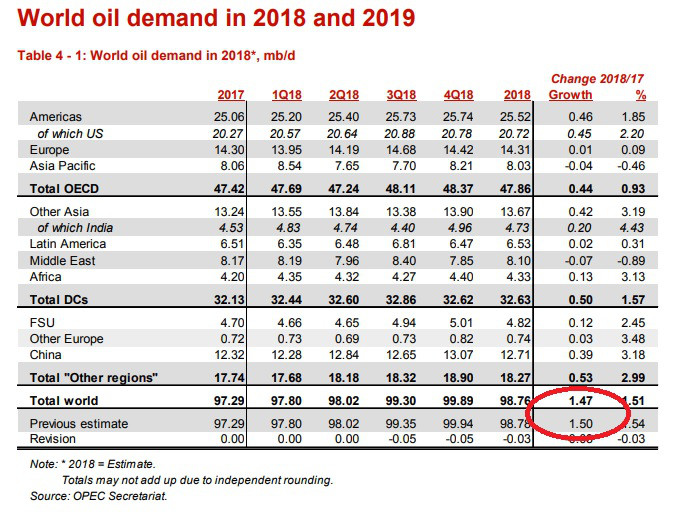
On average, world oil demand is up 1.5% per year since 1990.”
Assumptions are pretty much the same for 2019 with 1.47m barrels on new demand in 2019:

From those numbers, my conclusion was that with around 1m barrels in excess for the first 9months of 2018 and with Saudi Arabia still increasing production, we could see an excess production of 1.5m to 2m at the end of 2018.
In the meantime (from Q3 2018) Non-OPEC oil supply is up 600k barrels mainly from increase in U.S. production:
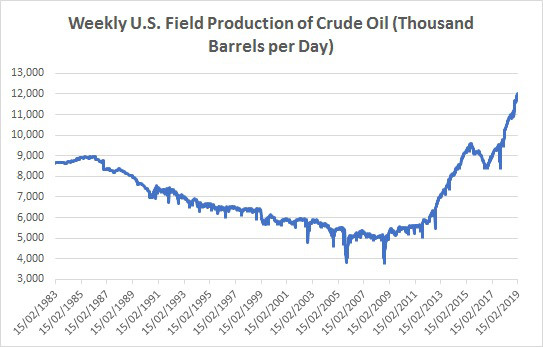
So with an oversupply of 1m barrels at the end of Q3 2018 and an additional 600k of non OPEC production, you end up with 1.6m surplus.
But what about OPEC commitments to reduce production?
Looking at the numbers below, production from OPEC countries in January 2019 was 1.1m lower than in Q3 2018.
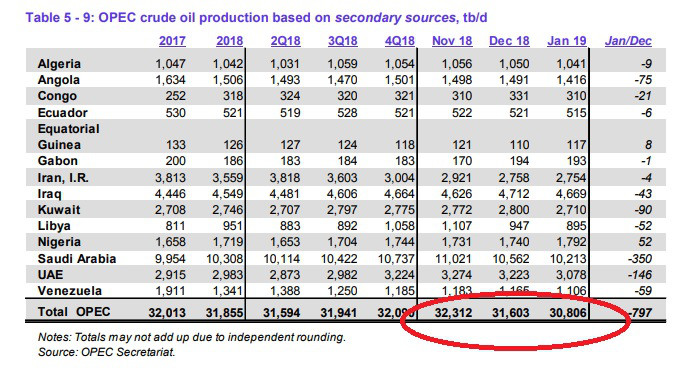
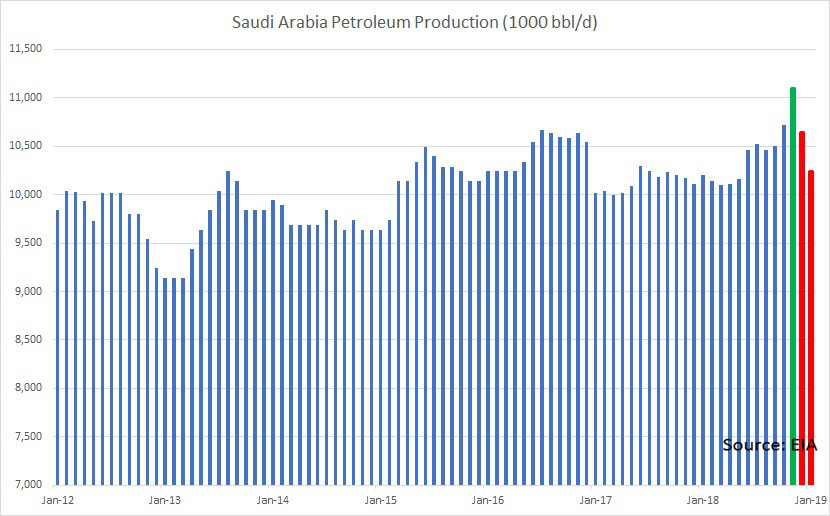
With Saudi Arabia cutting production in January 2019 by 800k vs the peak in November 2018 and by 500k vs end of Q3.
With 1m surplus at the end of Q3 2018, an additional 600k non OPEC production, this 1.1m cut gives you now only 500k surplus.
If you take any normal growth in Demand around 1.5m barrels per year, that should roughly gives you almost a perfect balance between supply and demand around March-April 2019.
Finally let’s have a quick look at Non-Opec supply in 2019:

We have a increase in production of 2.2m barrels yoy but it will be more accurate to look at end of Q4 2018 production that was around 63.58m barrels.
Taking this 63.58m we can see from the numbers above that new supply will only start to kick-in in Q3 2019. Before that, the production could be flattish to small down (300k barrels).
So, with demand “naturally” growing by around 500k barrels every 4 months and a possible production decrease of 300k in Q2 2019, you end up with a market fully balanced in March-April 2019 and maybe in a slight deficit in Q2 2019.
Hence no surprise that we had this tweet yesterday:
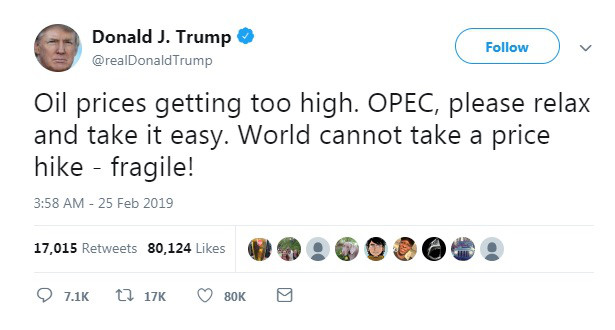
If Opec is cutting more production, no doubt that we could see a deficit earlier and a bigger one.
As I said previously, on those metrics and if there are no changes, Crude Oil should be trading between 50 and 60.
I hope it helps,
Gregoire
Sub Section Title Here
Lorem ipsum dolor sit amet, consectetur adipiscing elit, sed do eiusmod tempor incididunt ut labore et dolore magna aliqua. Ut enim ad minim veniam, quis nostrud exercitation ullamco laboris nisi ut aliquip ex ea commodo consequat. Duis aute irure dolor in reprehenderit in voluptate velit esse cillum dolore eu fugiat nulla pariatur. Excepteur sint occaecat cupidatat non proident, sunt in culpa qui officia deserunt mollit anim id est laborum.
THIS POST
LEARN ONLINE TRADING TODAY. THE PROFESSIONAL WAY.
Let us solve the problem and confusion around trading and finance management, the right way.
ACCESS FREE LECTURESUBSCRIBE
TO OUR BLOG
To receive opinions, market research, and data analysis in the Financial Markets
ABOUT
DUPONT TRADING
As a Professional Trader/Portfolio Manager/Hedge Fund Manager for almost 20 years, I know that learning how to Trade/Invest is a non-ending learning curve. This adventure is extremely exciting but needs to be ridden carefully.
In January 2018 after receiving many requests, I decided to start my own mentoring activities.
In October 2019, I launched the 4×4 Video Series to help Investors profitably manage their portfolios. By sharing my ideas/experiences and offering education through the 4×4 Video Series, I hope I can help you becoming a better investor.

Students
Testimonials

J. (United Kingdom)
LEARN ONLINE TRADING TODAY. THE PROFESSIONAL WAY.
Let us solve the problem and confusion around trading and finance management, the right way.
Reader Interactions