Buybacks, Dividends and Free Cash Flows

In a recent post (https://ftalphaville.ft.com/2019/11/13/1573644284000/A-quick-look-at-US-buybacks/) FT Alphaville discussed buybacks.
With 2020 in sight and the U.S. Presidential Campaign, we will read more and more similar headlines. If you add debates around how real wages have increased (or not) over the last 10 years or the different social widening gaps, you can be certain that you will be reading a lot about share buybacks in the next 12 months.
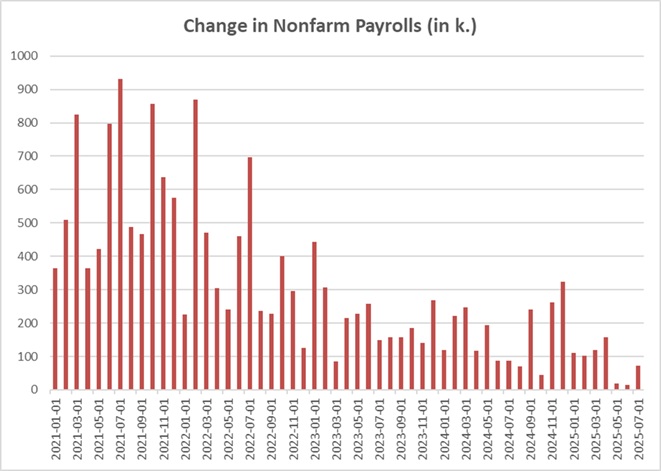
I would like to start with a 10 years picture of S&P 500 Buybacks:
Looking at the chart above, it is fair to say that there has been an acceleration of share buybacks in the U.S. over the last couple of years.
With earnings yield above the after-tax cost of debt, companies have a huge incentive of using buyback. Looking at earnings growth for the S&P 500 in 2020, which stands at the moment around 11-12%, we should assume that 1/2 of it comes from buybacks.
For example, below is the Top 20 U.S. share buybacks in $m (source: S&P IQ):
| Apple | $18,154 |
| Bank of America | $6,507 |
| Oracle | $6,301 |
| JPMorgan | $5,210 |
| Cisco Systems | $4,936 |
| Wells Fargo | $4,906 |
| Microsoft | $4,633 |
| Johnson Controls International | $4,125 |
| Alphabet | $3,577 |
| Citigroup | $3,464 |
| Intel | $3,049 |
| Booking Holdings | $2,718 |
| Johnson & Johnson | $2,486 |
| Amgen | $2,415 |
| Biogen | $2,402 |
| Visa | $2,152 |
| Lowe’s Companies | $1,944 |
| Mastercard | $1,921 |
| Honeywell International | $1,900 |
| $1,752 |
Apple, thanks to his Cash Flow generation and Cash pile, is sitting at the top. No surprise here.
But could all those companies afford a share buyback and did we experienced a recent acceleration in share buybacks?
On the second question, we should be looking at the two ways of rewarding shareholders (I am not talking about stock price going up here): dividends and buybacks. To get a fair picture, we have to combine those two and analyze recent trends.
Below 10 years of Dividend Yield and Buyback Yield for the S&P 500:
| Dividend Yield | Buyback Yield | Dividend and Buyback Yield | |
| 2009 | 2.0% | 1.4% | 3.4% |
| 2010 | 1.8% | 2.6% | 4.4% |
| 2011 | 2.1% | 3.6% | 5.7% |
| 2012 | 2.2% | 3.1% | 5.3% |
| 2013 | 1.9% | 2.9% | 4.8% |
| 2014 | 1.9% | 3.0% | 5.0% |
| 2015 | 2.1% | 3.2% | 5.3% |
| 2016 | 2.1% | 2.8% | 4.8% |
| 2017 | 1.8% | 2.3% | 4.1% |
| 2018 | 2.2% | 3.8% | 6.0% |
I see two things here: at 6%, 2018 was the highest year in terms of shareholders reward. 2018 was not very far from levels seen in 2011 though, ie two years after the Great Financial Crisis.
After looking at this big picture, I would like to cover more fundamental analysis.
When we are analyzing a company, we should know both its dividend yield and whether it has an active share buyback. As always when we look at quantitative analysis, we should be looking at past trends, recent trends and expectations. For example, when covering a company that is helpful to analyze the last 5-10 years and what the market’s expectations for the next 2-3 years.
Share buyback programs have specifics and we should be analyzing them before entering a position: the total amount, the time frame (when is it expiring), the minimum purchase price, the maximum purchase price, the maximum daily volume allowed…
But as underlined before, when looking at dividends and buybacks, we want to know if a company has the means to reward its shareholders with such dividend yield and share buyback program. If they can afford doing so.
That is where we should be looking (but not only) at Free Cash Flow = FCF.
FCF represents the cash generated after cash outflows to support operations and maintains its capital assets. When studying a company’s FCF, we should be able to identify how the company could finance its growth, pay its dividends, buyback shares or reduce its debts.
Let’s start with a game by trying to identify dividends/buybacks/FCFs for the five companies below: Apple, Walmart, Amazon, McDonald’s and Microsoft. Try to guess which data belongs to each company:
| Company A | 2014 | 2015 | 2016 | 2017 | 2018 |
| Dividends | (3.22B) | (3.23B) | (3.06B) | (3.09B) | (3.26B) |
| Share Buyback | (2.96B) | (5.78B) | (10.87B) | (4.23B) | (4.8B) |
| Free Cash Flow | 4.15B | 4.73B | 4.24B | 3.7B | 4.23B |
| FCF – (Div. + Buyback) | -2.03 | -4.28 | -9.69 | -3.62 | -3.83 |
| Company B | 2014 | 2015 | 2016 | 2017 | 2018 |
| Dividends | (11.13B) | (11.56B) | (12.15B) | (12.77B) | (13.71B) |
| Share Buyback | (45B) | (35.25B) | (29.72B) | (32.9B) | (72.74B) |
| Free Cash Flow | 50.14B | 70.02B | 53.09B | 51.15B | 64.12B |
| FCF – (Div. + Buyback) | -5.99 | 23.21 | 11.22 | 5.48 | -22.35 |
| Company C | 2014 | 2015 | 2016 | 2017 | 2018 |
| Dividends | |||||
| Share Buyback | |||||
| Free Cash Flow | 1.95B | 7.33B | 9.71B | 6.41B | 17.3B |
| FCF – (Div. + Buyback) | 1.95 | 7.33 | 9.71 | 6.41 | 17.3 |
| Company D | 2014 | 2015 | 2016 | 2017 | 2018 |
| Dividends | (6.19B) | (6.29B) | (6.22B) | (6.12B) | (6.1B) |
| Share Buyback | (1.02B) | (4.11B) | (8.3B) | (8.3B) | (7.41B) |
| Free Cash Flow | 16.39B | 15.91B | 20.91B | 18.29B | 17.41B |
| FCF – (Div. + Buyback) | 9.18 | 5.51 | 9.71 | 3.87 | 3.9 |
| Company E | 2014 | 2015 | 2016 | 2017 | 2018 |
| Dividends | (13.81B) | (9.88B) | (11.01B) | (11.85B) | (12.7B) |
| Share Buyback | (18.4B) | (13.81B) | (15.3B) | (11.02B) | (9.72B) |
| Free Cash Flow | 38.26B | 23.72B | 24.98B | 31.38B | 32.25B |
| FCF – (Div. + Buyback) | 6.05 | 0.03 | -1.33 | 8.51 | 9.83 |
To get the answers, you will have to watch this short video which comes from the Video 18 of the 4×4 Video Series – https://gregoiredupont.com/education :
[fvplayer id=”43″]
After watching this, you probably understand that behind the topic of share buyback lie more important issues:
How is the company generating FCF? What is the FCF trend? What FCF generation should I expect from that company based on its product cycle and the sector drivers? What are the market’s expectations? Can the company afford (or not) such a dividend and/or buyback? Are dividends and buybacks financed by FCF generation or with debt? Is the company under leveraged or using too much debt?…
In your investment process, you want to be able to generate ideas with different filtering, different criteria. Analyzing Free Cash Flows is a great booster to understand how a company is doing.
On the topic of FCF vs (share buyback and dividends), you could be looking at how the Free Cash Flows have been trending over the previous years and what are the growth expectations. Then you could compare on how over time a company is able to generate FCF and cover its dividends and buyback. If it is not covering then you might then have a problem.
And you could do this analysis on both a yearly trend and quarter trend, but that would be for another blog…
As mentioned above McDonald’s has been using leverage for many years now to finance buybacks and dividends. Similarly, General Electric was struggling over the last few years. As always and as the oil sector showed in 2015-2016, one of the questions to answer is to know if deterioration or improvement in FCF is just temporary or more structural.
Looking at earnings growth expectations, we should then consider which part is “organic” = coming from GDP growth and which part is from reducing number of shares for instance. We always need to keep in mind that buybacks in the long run should be financed by FCF. Meaning that in a downturn or slowdown, they will be affected.
To finish one a positive note, I would like to share the Top 20 Free Cash Flows expectations for the next 3 years.
| Company | 2020e | 2021e | 2022e |
| AAPL | 61,238 | 63,164 | 67,264 |
| MSFT | 39,063 | 44,978 | 45,078 |
| AMZN | 29,457 | 38,285 | 51,140 |
| T | 28,094 | 27,652 | 26,407 |
| GOOGL | 27,473 | 34,992 | 41,884 |
| JNJ | 19,843 | 23,706 | 26,490 |
| FB | 19,069 | 22,694 | 28,324 |
| VZ | 17,907 | 19,460 | 19,644 |
| WMT | 16,067 | 16,763 | 17,230 |
| CVX | 15,204 | 16,826 | 16,052 |
| CMCSA | 14,595 | 16,620 | 17,856 |
| INTC | 14,447 | 15,285 | 16,319 |
| UNH | 14,265 | 17,095 | 20,091 |
| CSCO | 14,218 | 15,444 | 15,368 |
| ABBV | 13,443 | 18,267 | 19,726 |
| ORCL | 12,831 | 13,345 | 14,590 |
| TFX | 12,513 | 14,827 | 18,414 |
| PG | 12,372 | 13,059 | 14,047 |
| V | 12,056 | 14,711 | 16,920 |
| IBM | 11,949 | 12,441 | 12,830 |
That is almost $1.4 Trillion of FCF expected to be generated in the next three years by those 20 companies alone. Or the top 20 FCF combined for 2020e represent roughly the Gross Domestic Product of Norway.
I hope it helps,
Gregoire
Sub Section Title Here
Lorem ipsum dolor sit amet, consectetur adipiscing elit, sed do eiusmod tempor incididunt ut labore et dolore magna aliqua. Ut enim ad minim veniam, quis nostrud exercitation ullamco laboris nisi ut aliquip ex ea commodo consequat. Duis aute irure dolor in reprehenderit in voluptate velit esse cillum dolore eu fugiat nulla pariatur. Excepteur sint occaecat cupidatat non proident, sunt in culpa qui officia deserunt mollit anim id est laborum.

THIS POST
LEARN ONLINE TRADING TODAY. THE PROFESSIONAL WAY.
Let us solve the problem and confusion around trading and finance management, the right way.
ACCESS FREE LECTURESUBSCRIBE
TO OUR BLOG
To receive opinions, market research, and data analysis in the Financial Markets
ABOUT
DUPONT TRADING
As a Professional Trader/Portfolio Manager/Hedge Fund Manager for almost 20 years, I know that learning how to Trade/Invest is a non-ending learning curve. This adventure is extremely exciting but needs to be ridden carefully.
In January 2018 after receiving many requests, I decided to start my own mentoring activities.
In October 2019, I launched the 4×4 Video Series to help Investors profitably manage their portfolios. By sharing my ideas/experiences and offering education through the 4×4 Video Series, I hope I can help you becoming a better investor.
Students
Testimonials

J. (United Kingdom)
LEARN ONLINE TRADING TODAY. THE PROFESSIONAL WAY.
Let us solve the problem and confusion around trading and finance management, the right way.
Reader Interactions